Fx Strength

Fx Strength is the indicator measuring the strength of a currency calculated over several currency pairs and over different (preselected) timeframes.
The RSI (Relative Strength Index) indicator is used for the calculation and in the near future next indicators for calculation will be added as a choice according to your own preferences (like Stochastic Oscilator etc.)
Settings
- You can set which currencies you want to monitor / measure (major, minor, exotic)
- You can set timeframes
- You can also set whether you want to display and calculate the average currency strength over selected timeframes
- You can sort currencies by strength for the selected or for each timeframe
- You can set strong and weak level (by defautl Strong>=60, Weak<=40) - And you can set period for RSI
How to use Fx Strength
It also depends on what type of trader you are and therefore what type of strategy you prefer. But the main point is to use the indicator to determine the strength of selected currencies and find the one (at least) "strong" and another one "weak".
The strong currency is the one in green numbers through all selected / monitored timeframes as possible (ideally in all)
The weak currency is the one in red numbers.
At this point there is a strong assumption that the given currency is really strong or really weak because the calculation is made by crossing all available currency pairs containing a given currency. So by that assumption we expect that given currency is the one that pulls the price up or down in that pair.
So if we have at least one currency strong and one weak, then we focus on a currency pair consisting of these currencies.
 One example is more than thousands words.
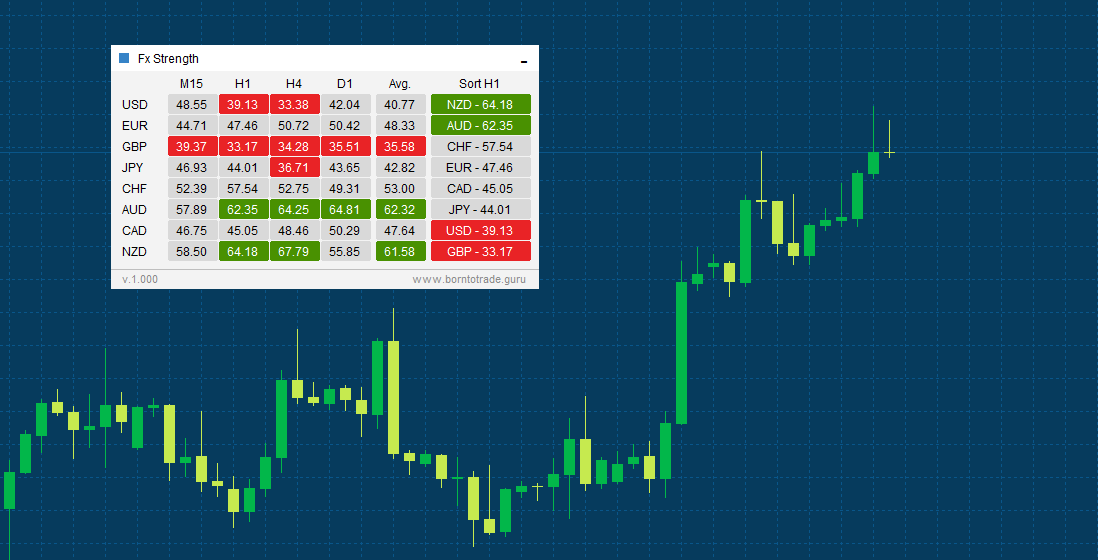
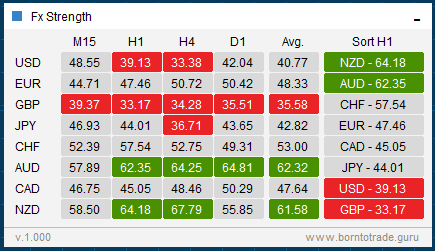
In this example we can see that the strong currency is AUD and the weak currency is GBP. So in our interest will be the currency pair GBPAUD. And the main trend of this currency pair is downwards.
Now, as I mentioned at the beginning, it depends on what type of trader we are and how we can use this information in our trading.
1. Trend Followers - for trend followers this may be signal to continue the trend. In this case, it is a good to look how long has the trend be there already. But for currency pairs, the trends are not long-lasting, so this needs to be considered very well here.
2. Swing traders - this type makes a little more sense to me in this case. The point is to wait when currency pair pullbacks from the main trend, and then take the action (and sell the currency pair - in this example) to the main trend. (counter trading)
Requirements
Operating system: Windows XP or more recent. (Note: If you want to use Mac operating system you need third party software (like Parallels) to run Windows on your Mac)
Screen resolution: Minimum of 1024x768
Internet: Connection speed of 36.6 Kbps or faster
Installed applications:Meta Trader 4 (Version 4.00 Build 1090) (It is possible it works for older builds, however it is not tested)
2021.07.31
Version 1.301
New features:
- -
Fixed:
- - Fixed rows for more symbols
2020.11.24
Version 1.300
New features:
- - Added Stochastic Oscilator calculation
- - Added option to switch between calculated numbers or suggestions to Buy/Sell (text)
Fixed:
- -
2020.07.05
Version 1.200
New features:
- - Possible to add other symbols to check RSI cross timeframes
Fixed:
- -
2020.06.27
Version 1.100
New features:
- - Improved "Drag and Drop" windows
- - Allow only one indicator on the chart
Fixed:
- - Recalculate after minimizig/maximizing window
2020.05.20
Version 1.000
First public release!